


NAVIGATING THROUGH MARKET VOLATILITY
WHERE IS THE MARKET HEADED?
Volatility may have some investors contemplating when they should pull out of the market or if they should sit on the sidelines and wait for the best time to invest. If you’re wondering if now is a good time to invest, consider some of the reasons that may have kept investors from out of the market in years past.
The stock market in general is forward-looking—it moves in anticipation of expected events. Because of this, market recoveries often start before a recession is officially over, as can be seen in the chart below. In fact, on average, stocks hit bottom four months before a recession has ended.5 Of course, past performance cannot guarantee future results.
Despite short-term ups and downs, over the long term the stock market has trended up. And often the best buying opportunities were when things still seemed quite bleak. By waiting for the perfect time to start investing, you may be too late.
S&P 500 INDEX PERFORMANCE OVER THE LAST HALF CENTURY
(December 31, 1969 – December 31, 2019)
Download full size chart below
SP500_Index_Performance_Over_The_Last_Half_Century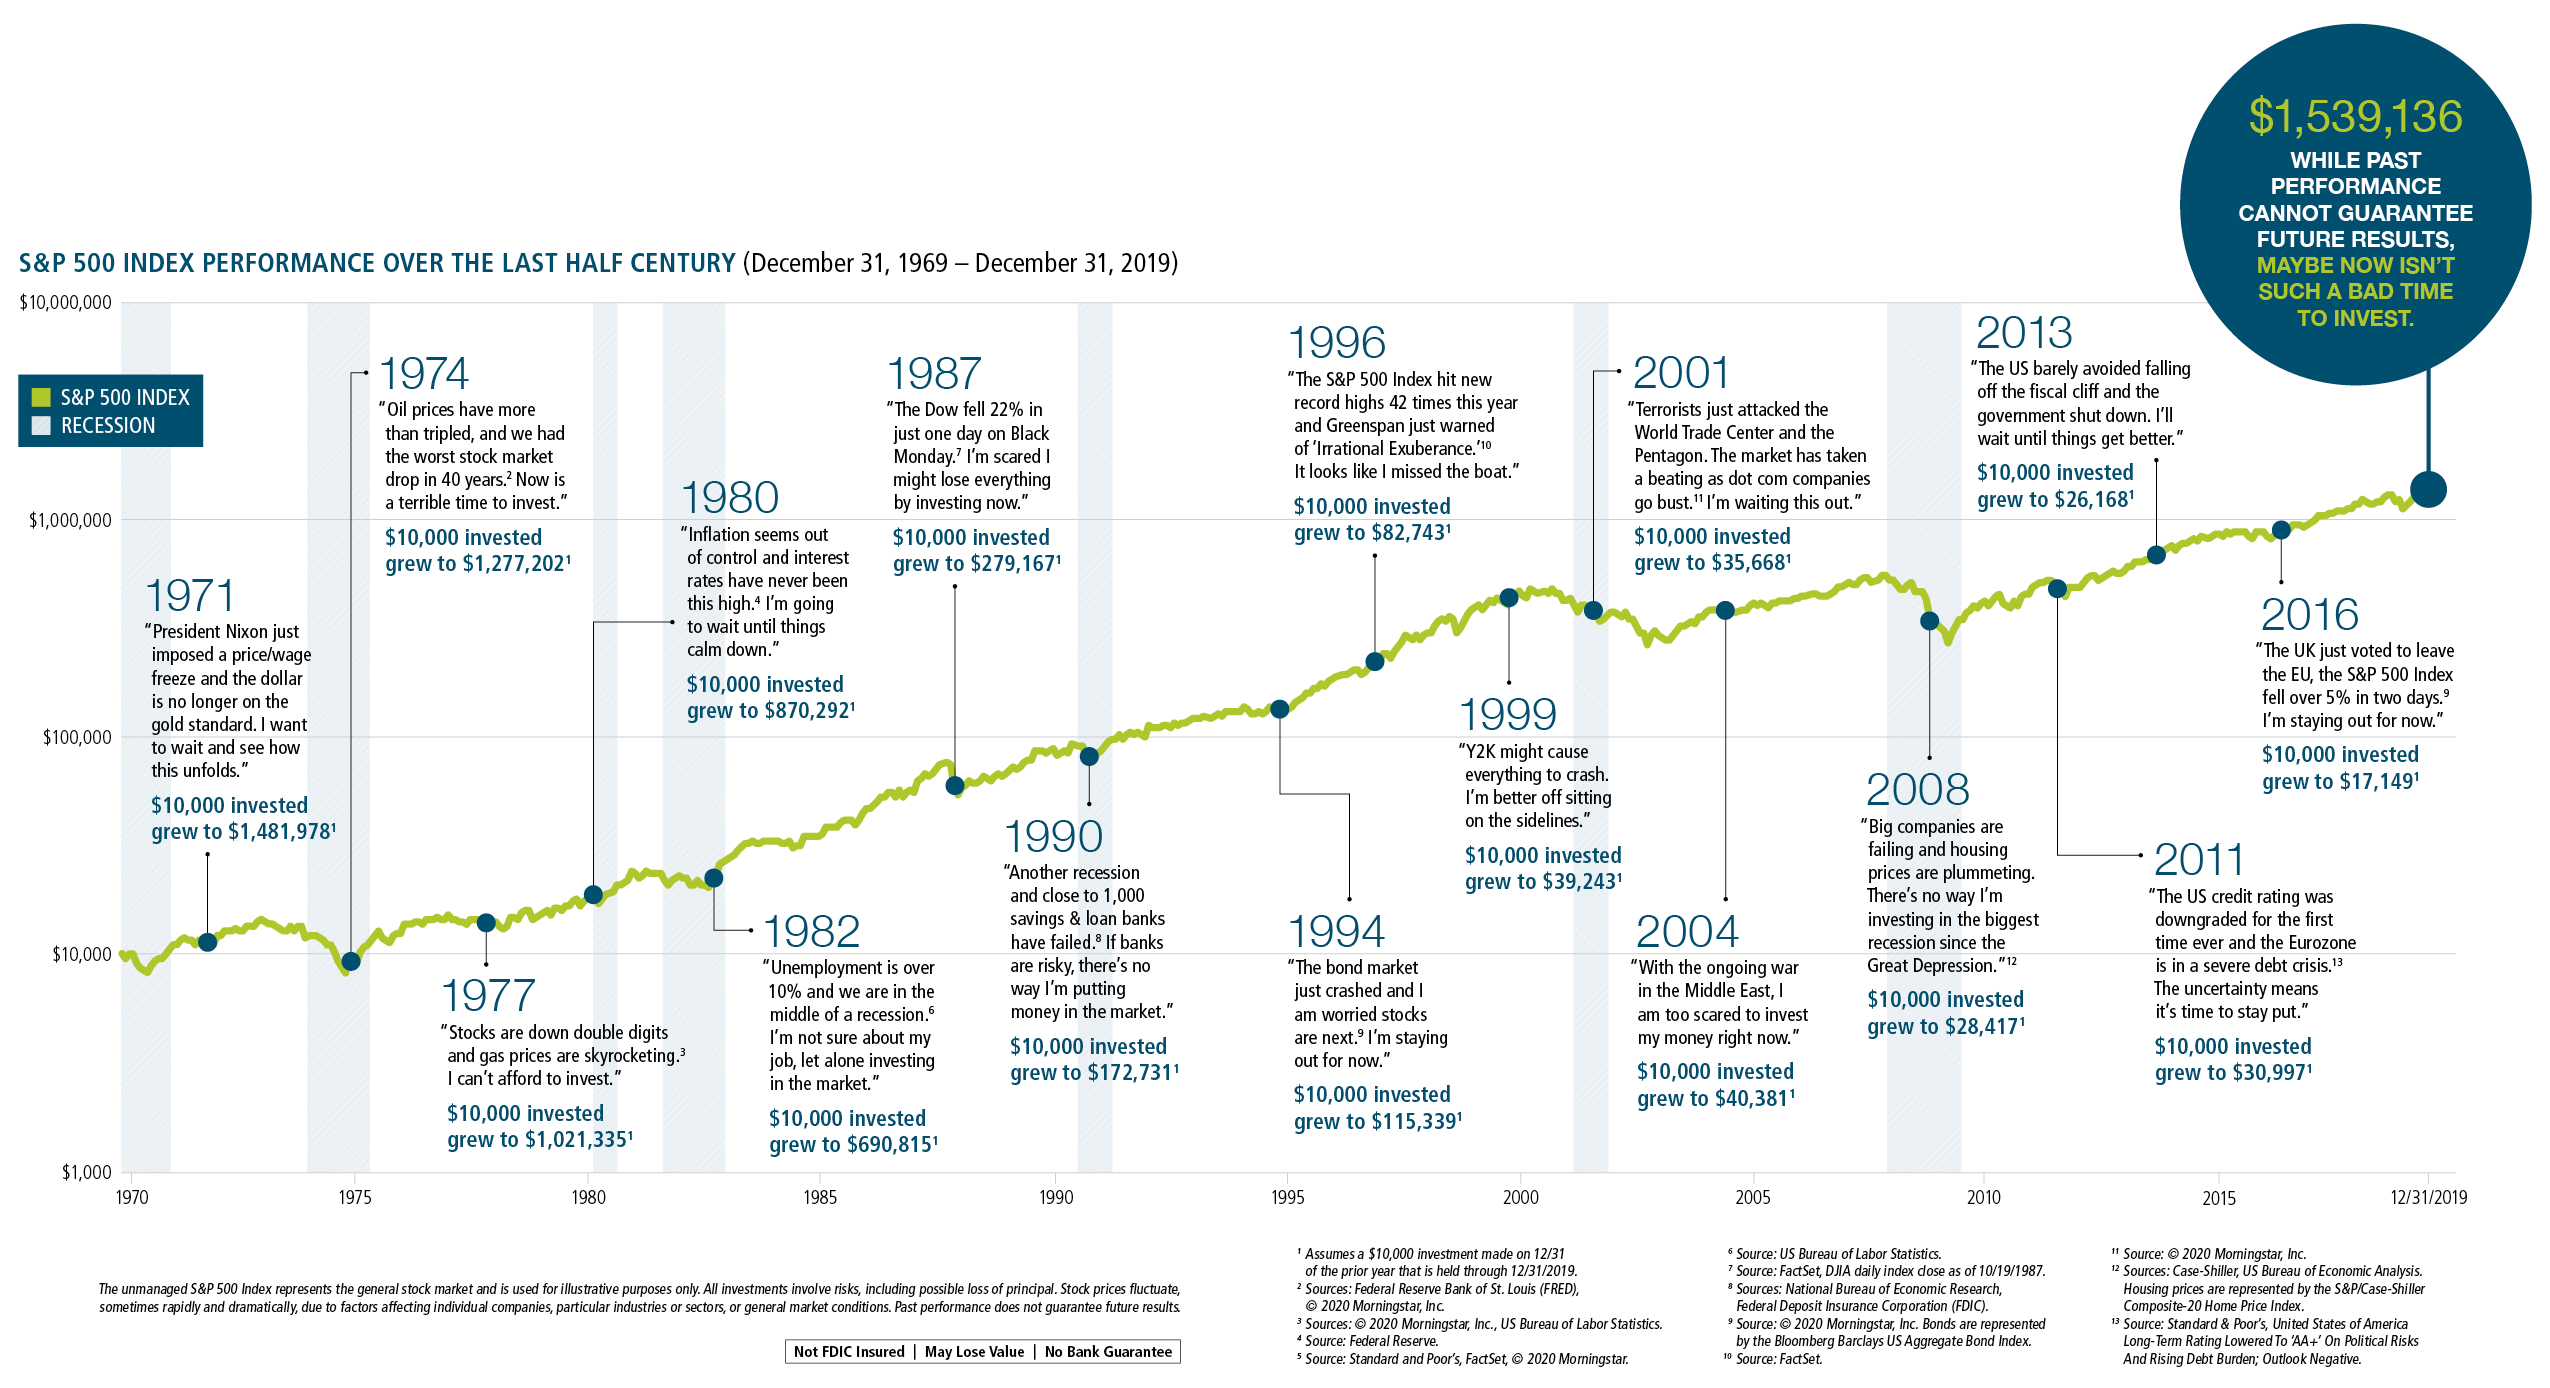
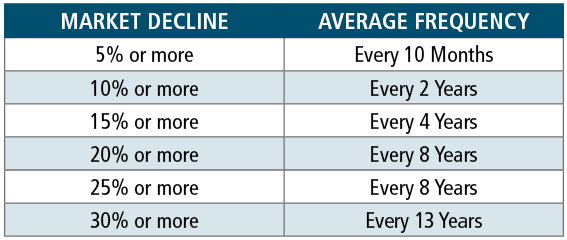
PULLBACKS ARE NORMAL
Consistently predicting when stock market declines or rallies will happen, or how long they are going to last, is impossible. While no one looks forward to market volatility, a historical perspective on the frequency and severity of past drops can provide a valuable perspective. The table to the right shows how frequently stock market declines of various amounts have occurred over the 50-year period ended December 31, 2019.14
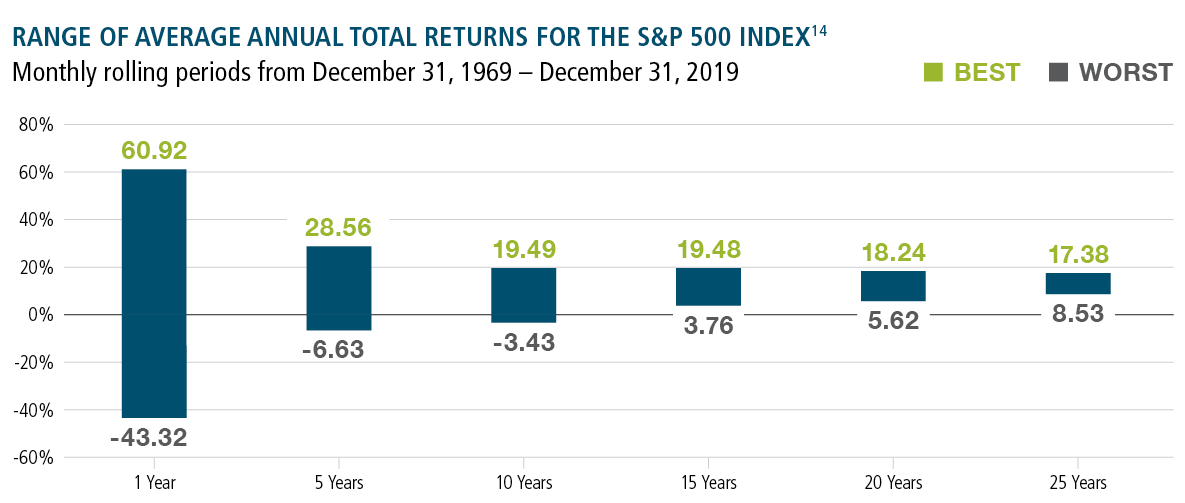
IT’S TIME IN THE MARKET, NOT TIMING THE MARKET
Buying stocks at market bottoms and selling only when prices are high is difficult, if not impossible. A better strategy is to focus on your investment goals, your risk tolerance and how long you plan to invest. Over the 50-year period ended December 31, 2019, stocks have averaged a 10.59% one-year return.14 But you can’t expect that return every year.
The chart below shows how the longer you were invested, the less likely you were to experience negative returns, and the more likely you were to experience an overall return closer to the long-term average.
For more information on the importance of long-term investing and how to deal with market volatility, contact us at BWFA or visit www.bwfa.com.

Robert Carpenter
President and CEO
The unmanaged S&P 500 Index represents the general stock market and is used for illustrative purposes only. All investments involve risks, including possible loss of principal. Stock prices fluctuate, sometimes rapidly and dramatically, due to factors affecting individual companies, particular industries or sectors, or general market conditions. Past performance does not guarantee future results.
Not FDIC Insured | May Lose Value | No Bank Guarantee
The charts above are for illustrative purposes only.
1 Assumes a $10,000 investment made on 12/31 of the prior year that is held through 12/31/2019.
2 Sources: Federal Reserve Bank of St. Louis (FRED), © 2020 Morningstar, Inc.
3 Sources: © 2020 Morningstar, Inc., US Bureau of Labor Statistics.
4 Source: Federal Reserve.
5 Source: Standard and Poor’s, FactSet, © 2020 Morningstar.
6 Source: US Bureau of Labor Statistics.
7 Source: FactSet, DJIA daily index close as of 10/19/1987.
8 Sources: National Bureau of Economic Research, Federal Deposit Insurance Corporation (FDIC).
9 Source: © 2020 Morningstar, Inc. Bonds are represented by the Bloomberg Barclays US Aggregate Bond Index.
10 Source: FactSet.
11 Source: © 2020 Morningstar, Inc.
12 Sources: Case-Shiller, US Bureau of Economic Analysis. Housing prices are represented by the S&P/Case Shiller Composite-20 Home Price Index.
13 Source: Standard & Poor’s, United States of America Long-Term Rating Lowered To ‘AA+’ On Political Risks And Rising Debt Burden; Outlook Negative.
14 Sources: © 2020 Morningstar, Standard and Poor’s.