


Rolling returns are a great way to measure investment performance (in this example the S&P 500 index). These rolling returns don’t correspond to calendar periods. We begin to understand investing more clearly as we compare the rolling stock market return periods of differing lengths of time.
To calculate rolling returns you take the return for each twelve-month period examined, add multiple successive periods together, and divide them by the number of years you are looking at. So, add up twenty years of successive twelve-month period returns and divide by twelve, or if you are doing this for a three-year rolling return add three years of returns and divide by three, etc. Maybe consider using a computer and set up some formulas to do the work if you are inclined to try this at home!
You have seen or heard us at BWFA discuss our focus on long-term investing. That is because we know the stock market, in the short term, can provide investors with very high rates of return, but also very low returns. Sometimes referred to as volatility. We want to smooth out returns and attempt to make them more reliable to meet our long-range goals by maintaining the long view.
Watching markets daily doesn’t appropriately connect us to clearly assess our long-term financial goals. We advise BWFA clients to focus on what the stock investing can do for you over the course of 20 years and beyond.
When looking at returns for the last 43 years (1973 to 2016, which covers lots of market and economic cycles) we see in the chart that in a one-year time frame of rolling returns, the best one-year index return is 61% (twelve months ending June 1983) and the worst is -43% (twelve months ending February 2009). We experienced one very good twelve-month period during that 43 years, one very bad, and many others in between.
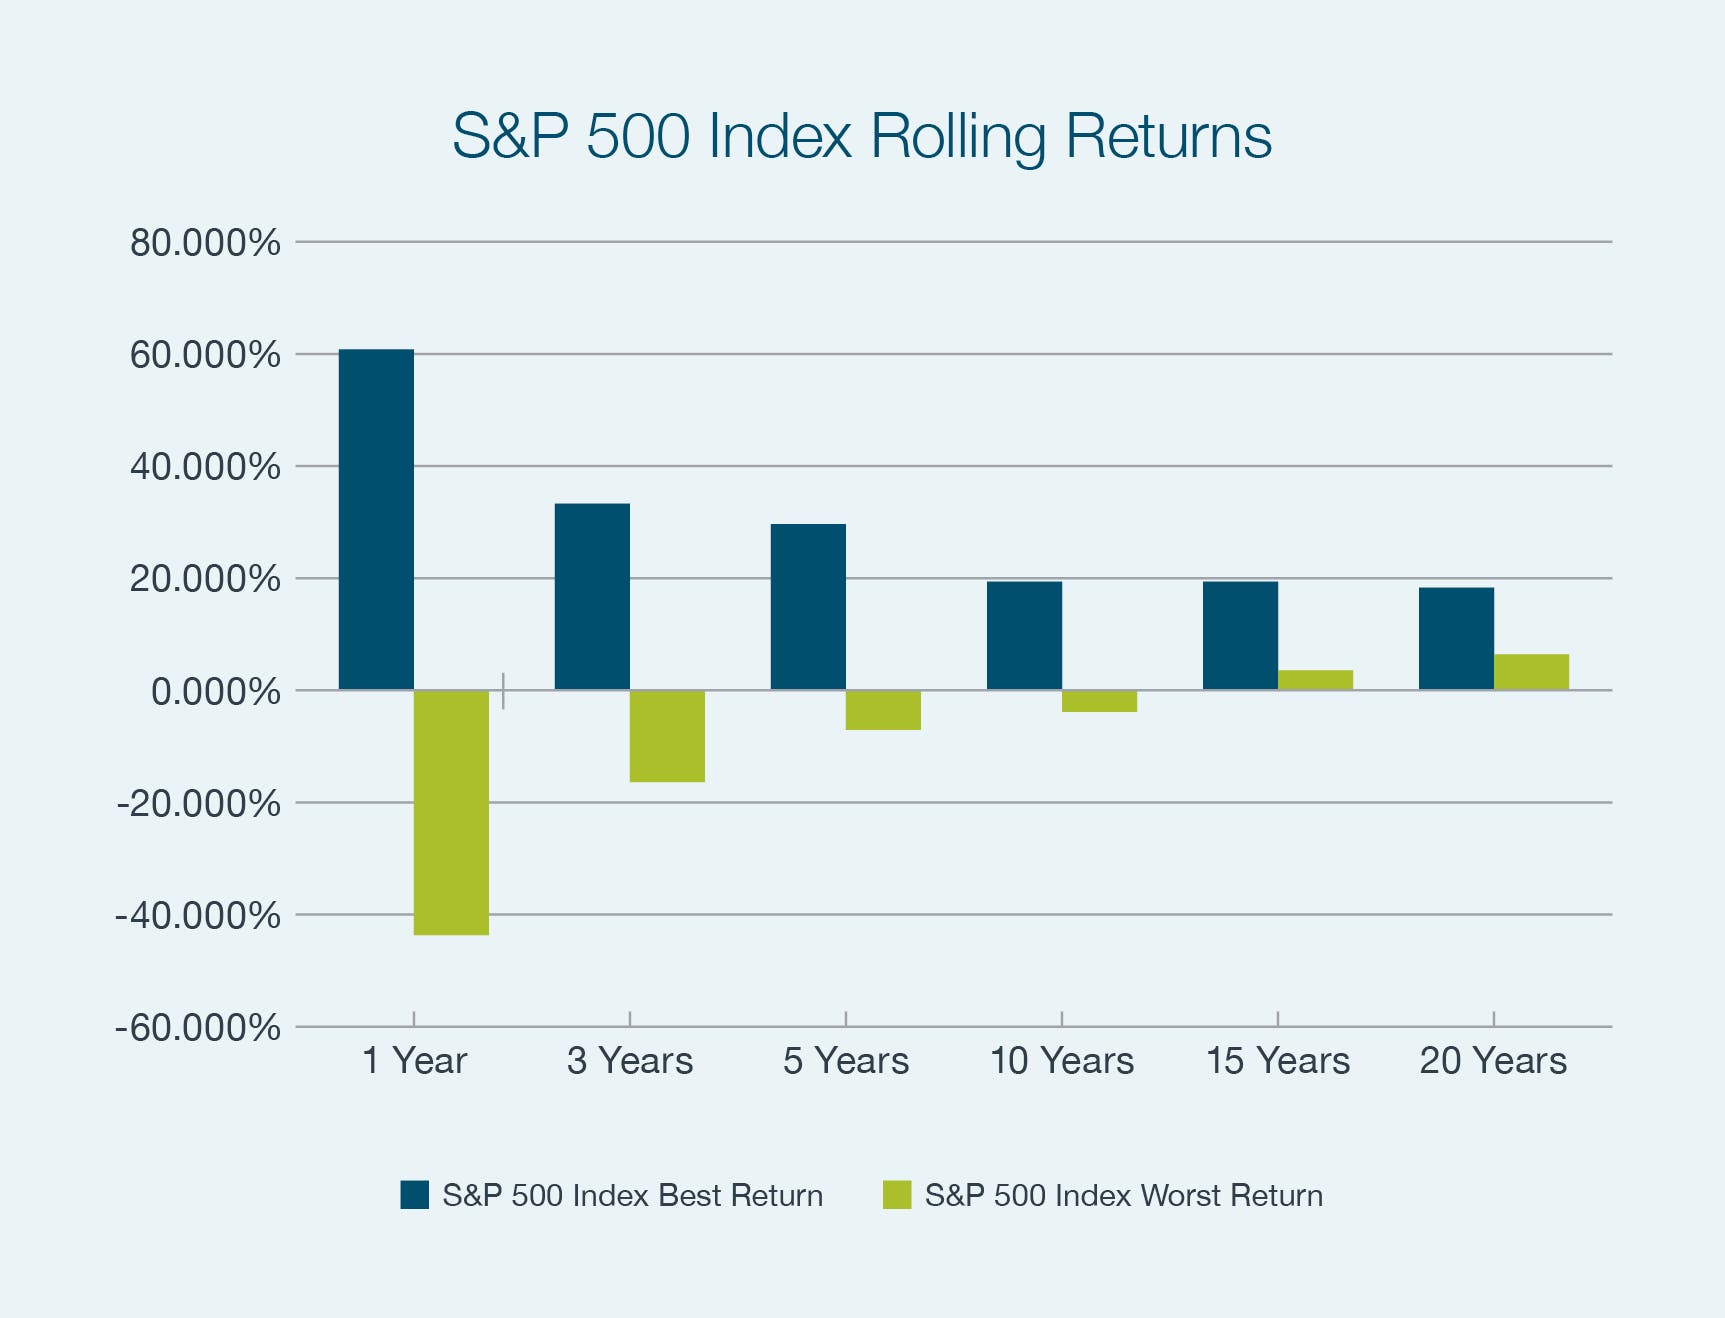
Over that same 43 years when contrasting one-year rolling returns with twenty-year rolling returns, the picture looks much different. If you invest long term, the worst rolling period of twenty years of S&P 500 annual returns provided a return of 6.4% per year (twenty years ending May 1979). That is not too bad, considering in the BWFA financial plan return projections we assume only a 6% annual return for retirees! During the best twenty-year period, you received 18% per year on average for those years (twenty years ending March 2000) — this meant your money doubled on average approximately every four years, for 20 years, had you been fortunate and diligent enough to stay invested during that period in the broad-based U.S. stock market (S&P 500)!
So, when we look at the time horizon for you and your family, the stock market, in general, could be quite reliable and produce solid positive returns over time. Watching markets daily doesn’t appropriately connect us to clearly assess our long-term financial goals. So, we advise BWFA clients to spare themselves the day-to-day angst of watching negative days in the market and focus on what stock investing can do for you over the course of 20 years and beyond.
JOSEPH MANFREDI
MBA
COO, Senior Portfolio Manager & Executive Manager
jmanfredi@bwfa.com