

Due to Great Britain’s vote to exit the European Union (Brexit), June 24 was a tumultuous day for the financial markets. In the U.S. the S&P 500 Index fell by more than 3%. Other markets around the globe fell even more. The S&P fell another 1.8% on Monday, closing barely above 2,000. Merely a week later, the market has reversed course. The U.S. stock market rallied sharply on Tuesday, Wednesday and Thursday, gaining more than 1% each day. As of Thursday’s close, the S&P 500 had recovered 88% of what it lost the previous week. On Friday, the market’s movement was more muted.
If you went away on vacation on June 23rd and returned on June 30th and looked at the market, you would think not much had happened. The index dropped a mere 0.68% during that time. Over one week, that is an insignificant change.
It is also important to note that based on the Vanguard World Stock Index Fund, the United Kingdom accounts for roughly 7% of the global stock market’s total market cap. The U.K. is the world’s fifth largest economy, but it is relatively “small potatoes” in stock market terms. It is important to remember that markets around the world were reacting to more than just the events in the U.K. Investors were concerned about the possibility that market unrest could result in a contagion that would spread to other countries as well as about how Britain’s vote to leave the E.U. would impact their markets and economies.
Investors should not be surprised by the market’s reaction to Brexit nor the related volatility it caused. No matter how large or small a company is, stocks often move up or down much more than seems justified because of news and events that have little real impact on the underlying business’ performance.
We decided to take a closer look at market volatility using our Bloomberg terminal. We started with the stocks that are currently in the S&P 500. There are 44 stocks in this index which currently have a market cap of $100 billion or more. We found that the average gap between the 52-week high and low price for these firms was 44% of the high price. We also learned that this equated to an average change in market value for these firms of $69 billion. The estimated change in market value for these firms ranged from $26 billion for 3M Co. to $238 billion for Apple Inc. Berkshire Hathaway is the only firm with a current market cap in excess of $300 billion that has seen its market value change by less than $100 billion.
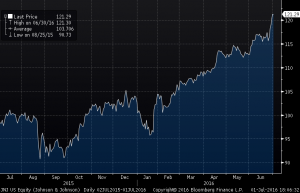
In addition to business-related factors, the price movement of a particular stock can also be influenced by the fluctuations of the overall market. At the same time, it is hard to imagine that a company like Johnson & Johnson[i] (see price chart) could be worth nearly $335 billion today and about $225 billion last August 25th (the day it fell to its 52-week low).
Intuitively, one would think that large companies would not be mispriced by the market. But, this is often not the case. Excessive pessimism or negativity can surround a company or its business, pushing the price down. Alternatively, problems faced by one company in an industry can be assumed to impact its peers similarly, pushing the price down unjustifiably.
When the market tumbles in the face of a perceived crisis, we often discuss in our commentaries how such events can provide opportunities to acquire shares in good companies at more attractive prices. The type of price fluctuations discussed in this commentary should provide some insight into why we feel this way.
Further Reading:
Market Fluctuations of the 10 Largest Companies
________________________________
[i] Shares of Johnson & Johnson are currently on BWFA’s “Buy/Hold” list and may be held in client portfolios.